As Central Banks globally increase interest rates to reduce inflation rates well in excess of their targets, several have turned to Quantitative Tightening (QT) to assist with tightening financial conditions to reduce economic activity. QT in practice is achieved by returning bonds back to the market, either through asset sales or redemptions, meaning that investors must absorb more government bond supply. Put simply, QT is effectively Quantitative Easing (QE) in reverse.
QE and the Need for QT in the US
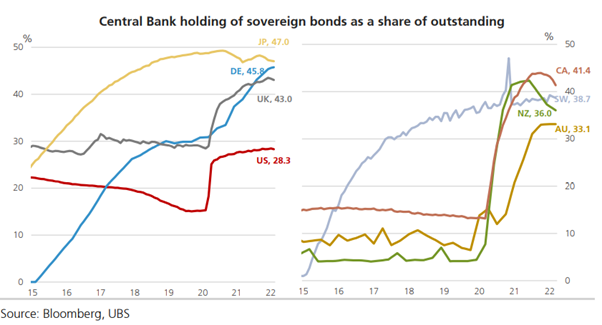
We should say ‘In response to the COVID-19 shock, the US’s central bank, The Federal Reserve (the Fed) reduced interest rates by 1.5% to effectively 0% and announced QE plans in March 2020, pledging to buy as much government debt as it needed to support the markets for housing and Treasury bonds. As illustrated in Figure 1 below, the Fed increased their balance sheet by a massive 76% in 2020 and 19% again in 2021. Over this period, securities on the Fed’s Balance Sheet doubled, from 3.9tn in March 2020 to 8.5tn in May 2022, an increase from 18% of GDP to 35% of GDP. These assets purchases increased the number of reserves in the system, expanding the monetary base, encouraging banks to increase their lending and overall spending in the economy. With jobs gains solid, and the economy relatively robust, the Federal Reserve are activating QT along with increases in interest rates to rein in inflation rates at levels not seen in 30yrs.
The Fed are now in the process of shrinking their roughly USD 9tn balance sheet. In September, the monthly cap of Treasuries and Mortgage-Backed Securities (MBS) to mature have effectively doubled, increasing to USD 60bn and 35bn respectively, the fastest pace of balance sheet reduction in history. Although the Fed has not stated the length and size of this period of QT, some market participants estimate the terminal size of the balance sheet to be roughly USD 6.5tn.
Figure 1
Active QT – New Zealand and the UK
The Bank of England (BoE) are also undertaking active sales from their government bond portfolio with bond redemptions of 50-100bn during the first year. Similarly in NZ, the RBNZ are underway with reducing their LSAP (Large Scale Asset Purchase Programme) holdings, which includes sales of LSAP bonds maturing in 2028 and longer of 5bn/yr, alongside maturities to be allowed to roll off with their New Zealand Government Bond (NZGB) holdings unwinding to zero in 2027.
Impact of QT on Risk Assets
Some investors are concerned about the impact that QT could have on markets, as asset returns have displayed high correlations with central bank purchases, as risky assets such as shares and credit have tended to perform well when central banks buy bonds. Morgan Stanley have modelled the changes in financial variables and concluded that balance sheet normalization this year is equivalent to 25bps in hikes in Fed Funds. Higher interest rates led to lower discounted valuations for risky assets given higher discount rates. The Fed’s own research suggests that at its peak impact, QE lowered yields on 10-year US Treasuries by 100 bps, however this has been questioned by academics. These points alone would justify any unease felt by markets.
We can also look to prior episodes of QT as a guide to how assets may perform during this round of QT. From Jan 2018 to August 2019, the Fed reduced its balance sheet by $50bn/month, a total reduction of 729bn. However, this period of QT ended in September 2019, when short-term funding markets spiked as bank reserves dropped below ample levels required for market functioning. This led the Fed to restart QE and lending in funding markets. Although QT in the US is starting earlier in the Fed’s overall tightening phase, and the Fed’s Treasury Portfolio is shorter in maturity than in 2019, the lessons learnt will lead the Fed to proceed cautiously.
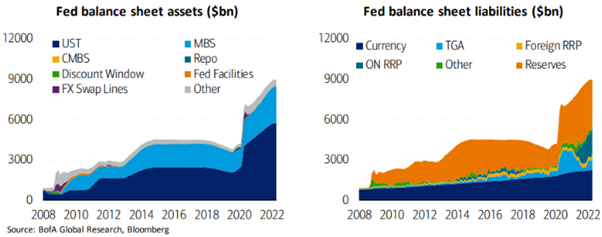
However, it is expected that reduction in global central banks’ balance sheet will be far smaller than the increases that we have seen over the past few years. Therefore, the direct impact of QT maybe smaller than the impact of QE. The base-case from financial giant UBS is that the Fed’s QT will see limited market impact. This is not just because the Fed’s holdings as a percentage of outstanding treasuries is low relative to other central banks, as shown in Figure 2 below, but also because the Fed’s roll-off of Treasury holdings may be refinanced with a higher portion of bills. Hence the supply of bonds and impact to bonds yields and risky assets should be lower during QT.
Figure 2