Most investment products, including Milford’s Investment Funds, come with recommended investment time frames. These are an element of investing that should be taken into serious consideration when investors look to match potential investments to their own financial goals.
Investment markets, such as bonds, shares and property, all present investors with very variable return potential over time. More often than not, when we look through history, these markets go through cycles of providing both negative and positive returns. The cycles are never consistently predictable, nor are they the same in their duration or severity. But they should be expected as part of a normal investment life cycle.
Investors therefore need to think very carefully before they invest about how much variability they are willing and able to experience from their investment. History suggests that, given the appropriate time and good management, higher risk assets will provide investors with higher returns. Higher risk though also means higher variability, commonly referred to as volatility in the investment world. The higher the risk, the bigger the swings you’re going to need to be comfortable with along the way, including tolerating periods of negative returns. Negative returns can be psychologically challenging for most investors and can drive us into short-term thinking, making it hard to zoom out and remind ourselves of the bigger picture. Understanding your ultimate goals and looking back at the bigger picture during these times is incredibly important to stop ourselves making emotional knee-jerk decisions.
The below chart is a stylised way of demonstrating the concept of risk, return and volatility over a 5-year time frame.
Starting with the blue dotted line representing a low-risk investment such a term deposit. Here, we know with relative certainty the return that we will receive, with no expected variability until the term ends. However, to get this certainty we have to accept that returns are going to be constrained at the particular fixed rate the bank is willing to offer. This predictability in outcome is attractive to those who need and value the surety of the end result.
The yellow line represents an investment made up mostly of bonds, with a small portion of shares. Here we see the return becomes variable, going through cycles of higher and lower returns. The swings are reasonably moderate and ultimately the investment, in theory, on average provides a return above that of the term deposit at the end of the 5 years.
Finally, the solid orange line represents an investment portfolio made up exclusively of shares. Here we see the highest level of volatility over time, with large swings in returns. At various times on the five-year horizon the investment dips into negative periods of performance, well below that of the lower risk options, but ultimately ends up providing a higher return than the lower risk examples.
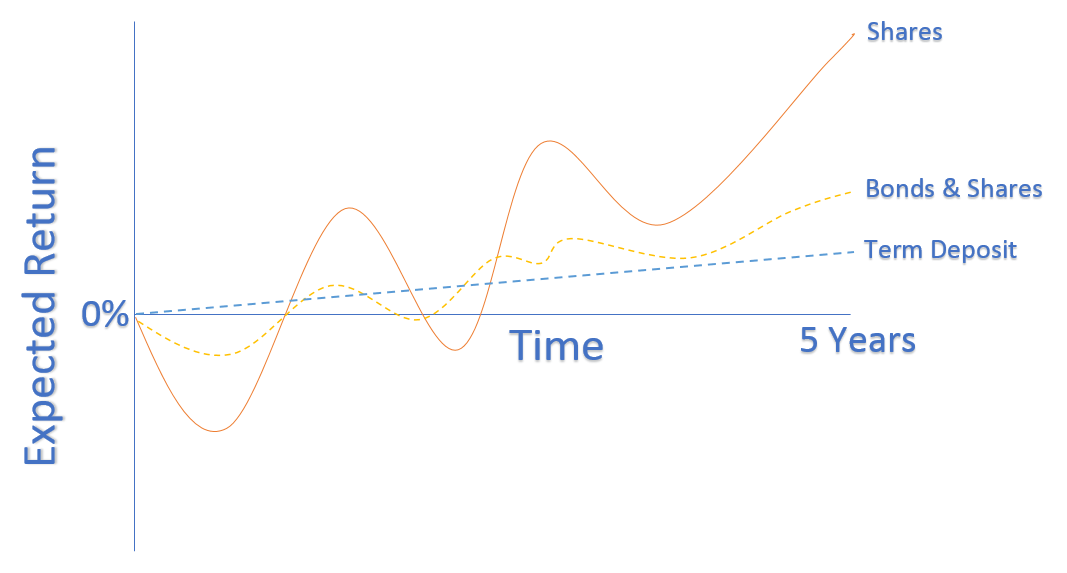
Please note this chart is for illustrative purposes only, real returns will vary. It is not drawn to scale. Past performance is not a guarantee of future performance.
So, how can investors apply this to their choice of investments?
Before you invest, think about your ultimate goal or reason for investing. For example, if you plan to use the money within the next year or so to purchase a property then you likely need certainty that the lower risk investment will provide. If alternatively, you are saving for retirement in 15 years’ time, then you can afford to weather the variability of the higher risk options along the way to maximise your potential for higher returns.
Remember to review your time horizon and goals at regular intervals. Time frames should be thought of on a rolling basis, not a count down. So, the closer you get to requiring your capital, the more certainty you need. You therefore may need to move down the risk spectrum to lower risk options as you move through time towards your goal.
When those negative periods in the cycles present themselves, look back at your goals and the time frames you have set out to achieve them. Looking at the bigger picture can help you make strategic long-term investment decisions and prevent emotional knee-jerk responses to shorter term cycles.