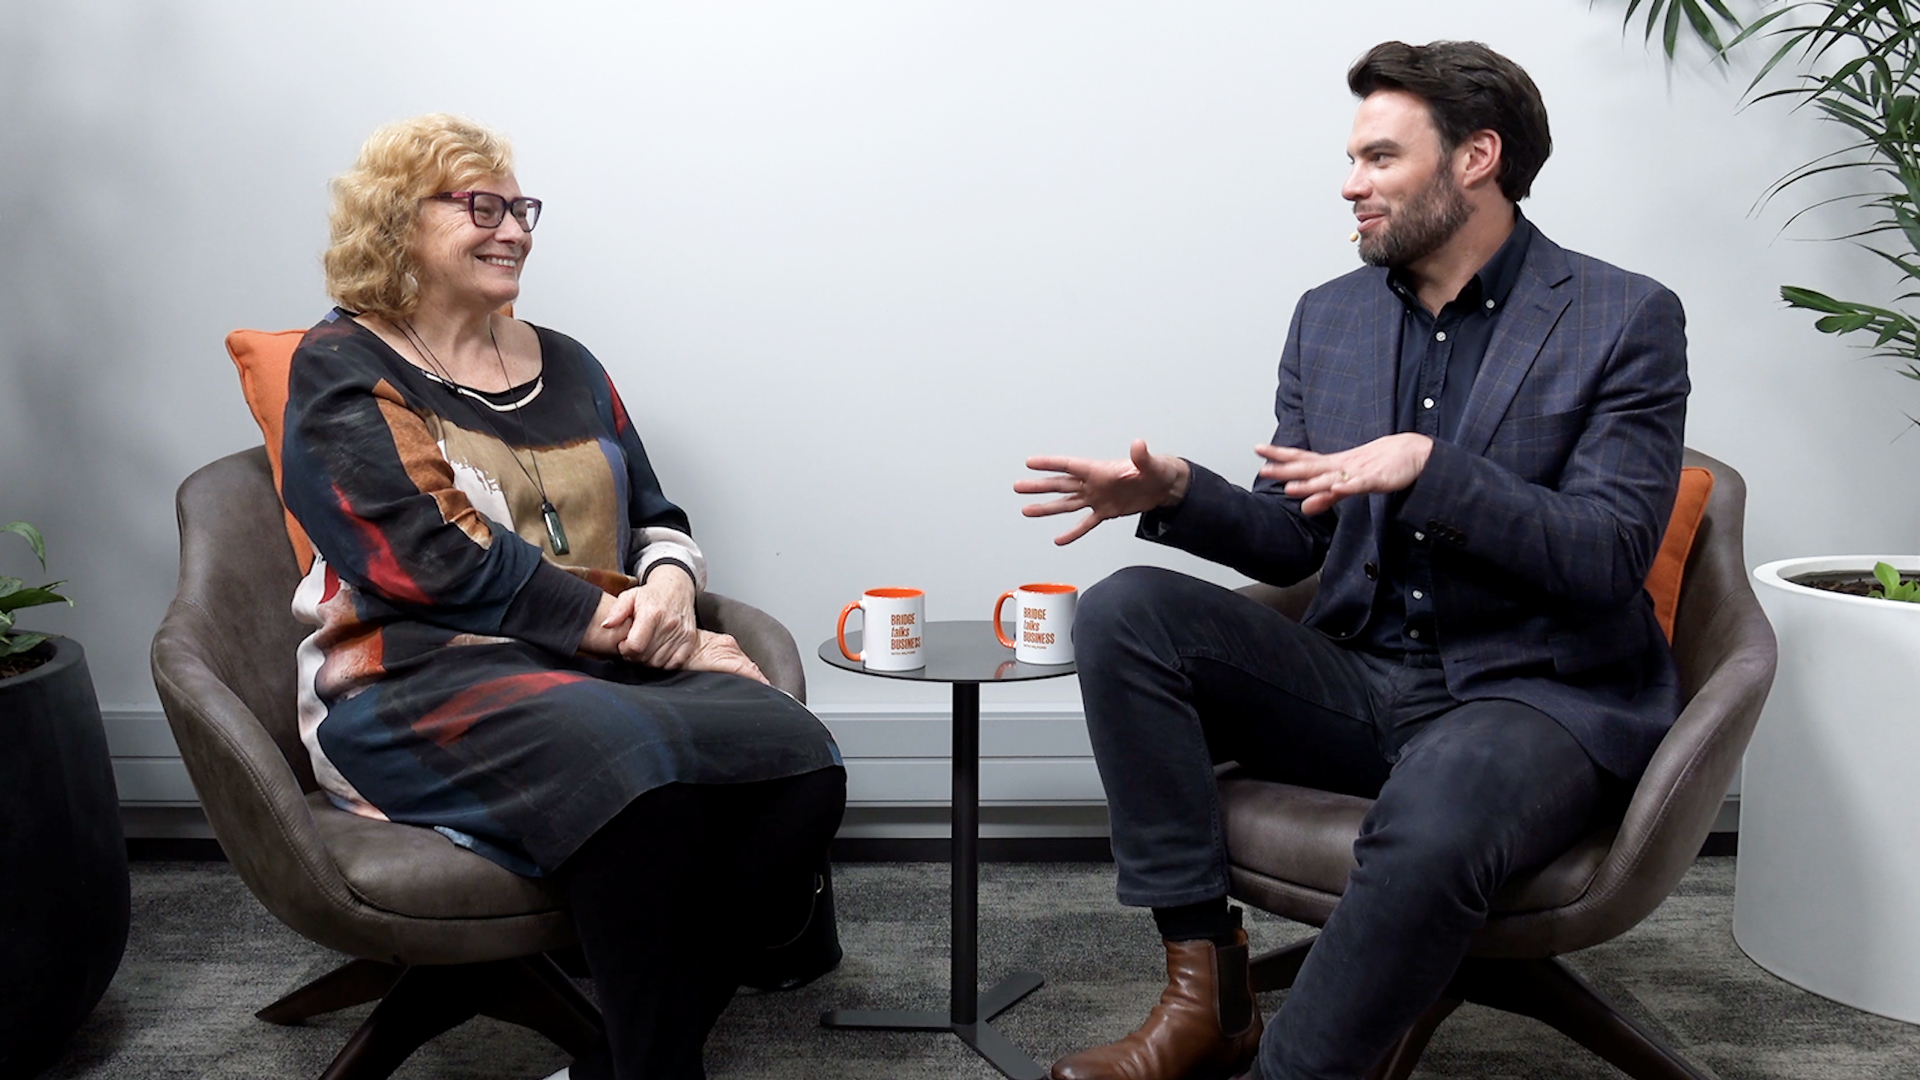
Ryan meets with Retirement Commissioner Jane Wrightson to talk through her views on NZ Super, whether KiwiSaver should be compulsory, and possible changes to the retirement income policy.
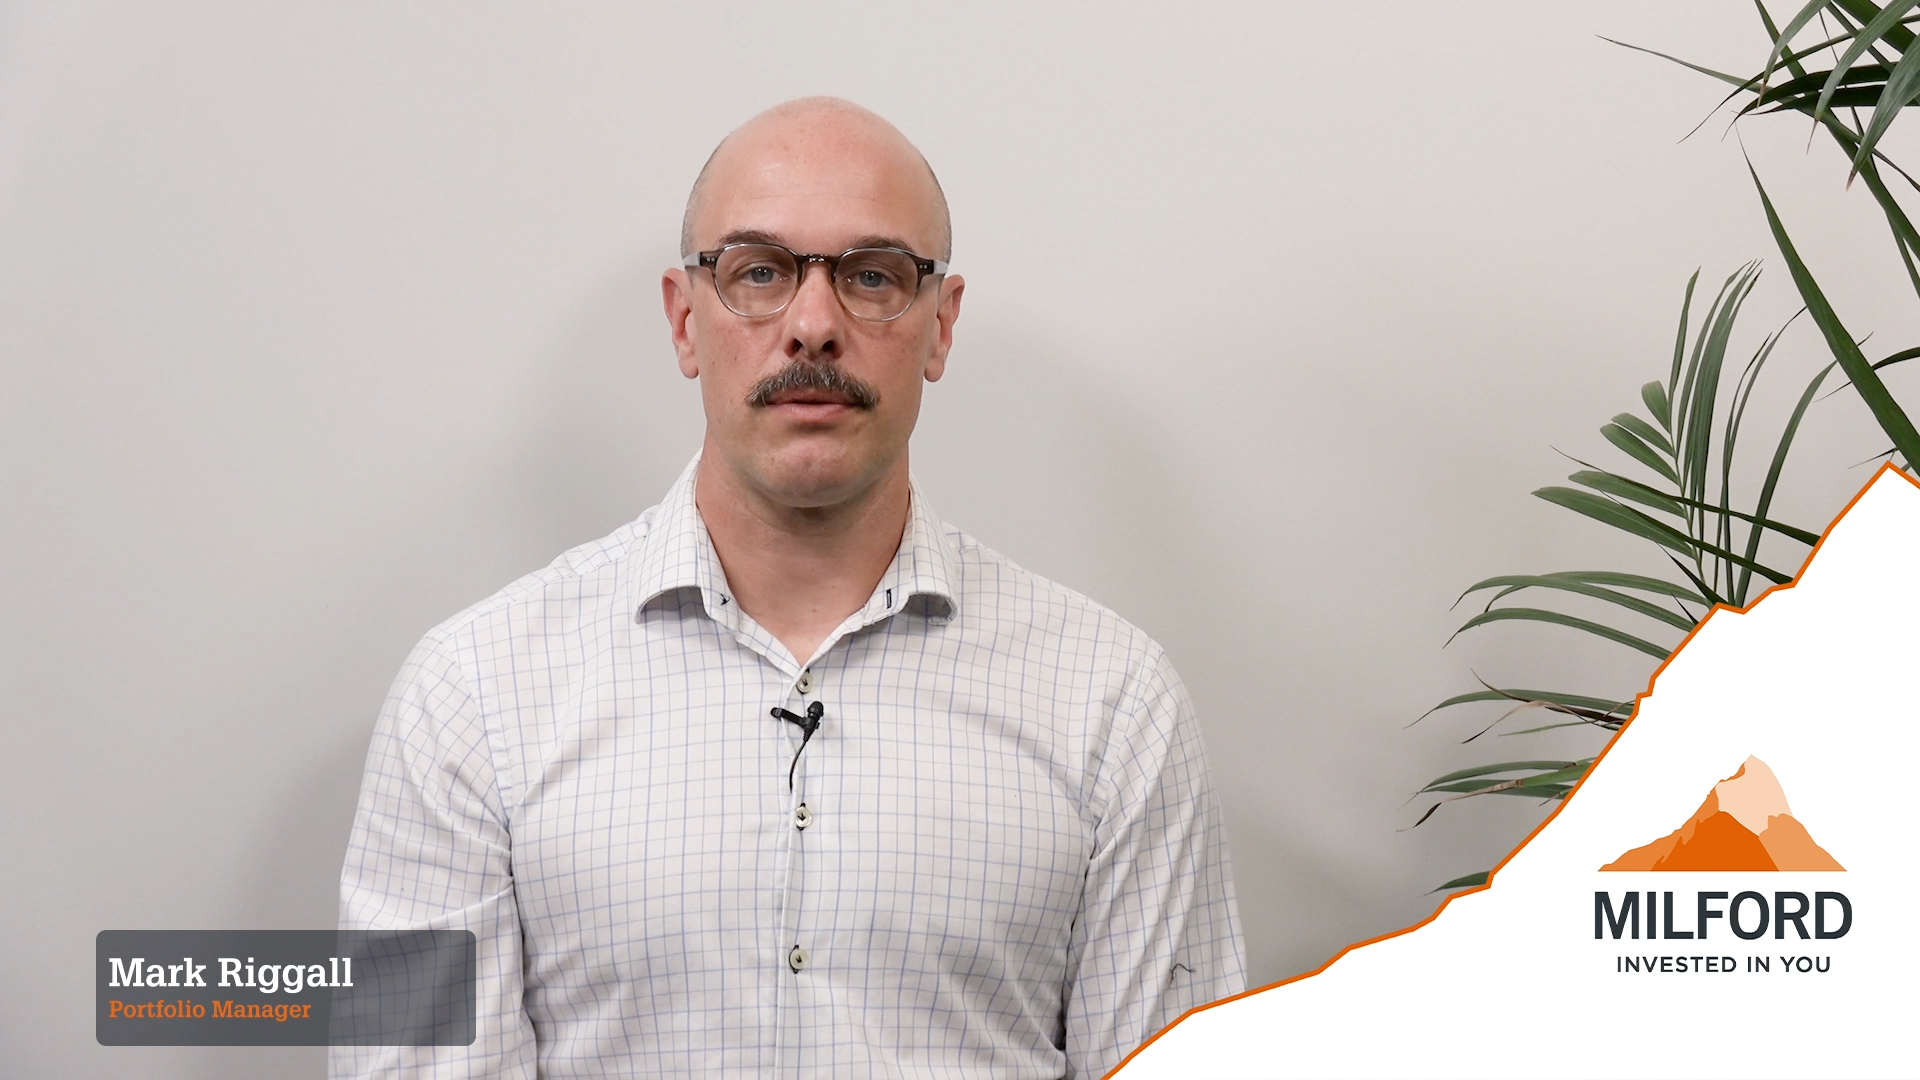
Headlines vs Reality: Why Share Markets Go Up Over Time
“Share market hits record high.” You’ll see that headline in the news, sometimes alongside stories that feel anything but positive….
In this section you’ll discover tips and tools to maximise your KiwiSaver – like making sure you receive the annual Government Contribution, understanding compound returns, and how to know if you’re in the right Fund or Fund mix.
Planning for a retirement can feel overwhelming. Our investment experts have compiled a range of resources to help you start considering your next steps.
In this section, we’ll debunk some investing myths, demystify what happens to your hard-earned money, provide some top tips from your 20s through to your 60s, and walk you through how to get started.
Every Wednesday, host Ryan Bridge breaks down topical business stories, market updates, and investment insights alongside Milford’s team of experts and New Zealand business leaders. Listen now on your favourite podcast channel:
Milford’s Insights
Subscribe to regular insights from our investment experts.